Parsons Realty

Full Service - Low Flat Fee

  • Home
  • Real Estate Search
  • Buyers
  • Blog
  • Contact Us
You are here: Home / Archives for Blog

Redding Flood Hazard Area – Insurance

Special Flood Hazard Map for ReddingFlood insurance can be a hidden cost of home ownership.  Before you buy a home in Redding we recommend you consult the Flood Insurance Rate Map.  Many areas of Redding are within mapped Special Flood Hazard areas.  As a public service, the City of Redding will provide you with the following information:

Whether a property is in or out of the Special Flood Hazard Area as shown on the current Flood Insurance Rate Map (FIRM) of the City.

Additional flood insurance data for a site, such as the FIRM zone and the base flood elevation or depth if shown on the FIRM.  If there is an Elevation Certificate or Letter of Map Amendment on file, copies can be made upon request.

The City of Redding also has a handout on the flood insurance purchase requirements that can help people who may need a mortgage loan for a home located in the Special Flood Hazard Area.  Another important note, the City of Redding attained a “Class 6” rating in the Community Rating Service (CRS) program which ensures a 20 percent discount to policyholders within a Special Flood hazard Area.

To make an inquiry with the City of Redding, you will need the street address or the Assessor’s parcel number of the property.  Here’s the best part, there’s no charge for these services.

You can reach the City of Redding Monday through Friday from 8 a.m. to 5 p.m. (excluding holidays) by calling (530) 225-4020 or go to the City of Redding Development Services Department in City Hall at 777 Cypress Avenue.

The above information was provided as a courtesy from Douglas DeMallie, Planning Manager for the City of Redding.

Mortgage Rates Continue To Drop To Record Lows

Redding Home Mortgage RatesToday Freddie Mac released the results of their Primary Mortgage Market Survey, and rates continue to reach record lows.

“Existing home sales plunged 27 percent in July, while new homes fell 12 percent to a newall-time record low, which led to some market concerns that the housing market may slow the economic recovery. As a result, long-term bond yields fell to the lowest levels since January 2009, allowing fixed mortgage rates to ease to new record lows this week,” said Amy Crew Cutts of Freddie Mac.

The 30-year fixed-rate mortgage (FRM) averaged 4.36 percent with an average 0.7 point for the week ending August 26, 2010, down from last week when it averaged 4.42 percent. Last year at this time, the 30-year FRM averaged 5.14 percent.

Amy Crew Cutts also said “Much of the slowdown in sales, however, was expected due to the recently expired homebuyer tax programs, which pulled through future home purchases into the first half of the year. For instance, average existing home sales over the first seven months of 2010 were nearly 8 percent higher than over the same period a year ago.”

“Moreover, house prices still appear to be stabilizing. Nationally, house prices rose 0.9 percent on a seasonally-adjusted basis during the second quarter of this year this year after 11 consecutive quarterly declines, according to the Federal Housing Finance Agency’s purchase only index. Eight of the nine census regions experienced positive gains, compared to none in the first quarter.”

Our New MLS Listings Feature Walk Scores

What’s a Walk Score?Walk Score - Couple Walking

Do you remember the old days when people used to walk?  Well, walking is starting to outpace some other forms of exercise.  Deciding to walk is becoming a popular choice for people in Redding these days.  So much so, we have added the “walk score” to some of our homes listed for sale.   The walk score is determined by an algorithm and the score is associated with each unique Redding address.  The walk score represents how “friendly” the address is for people choosing to walk vs. driving.  And, contrary to what some people believe, the walk score has nothing to do with how scenic the area is.

My wife thought certain neighborhoods in Redding had high walk scores because of the views of Mt. Shasta.   Well, maybe the Mt. Shasta Mall!

Technically speaking, the walk score increases when an address is within 1 mile of amenities.  The highest score is given to locations with .25 mile of major amenities and decreases to zero when there are no amenities within a 1 mile radius.

So, does this mean a home in Redding is worth more when it’s located next to Best Buy?  Probably not, but the walk score would certainly be high!

Walk Score Description:

90–100 Walker’s Paradise — Daily errands do not require a car.

70–89 Very Walkable — Most errands can be accomplished on foot.

50–69 Somewhat Walkable — Some amenities within walking distance.

25–49 Car-Dependent — A few amenities within walking distance.

0–24 Car-Dependent — Almost all errands require a car.

The Walk Score can certainly help out-of-town people searching Redding homes for sale on the Internet.  However, for those of us who already live here, we already know many areas of Redding may not score high or even at all using the walk score system.  And, that my friends, is why I live in Redding.  I love the fact that we we’re not a big city with miles of sidewalks nor the crime or pollution that goes with big city life.  I love Redding just the way it is.

In case you’re curious, the Walk Score was started in 2007 by Seattle software company known as “Front Seat”.

To see the Walk Score in action, check out our Redding MLS Listings.

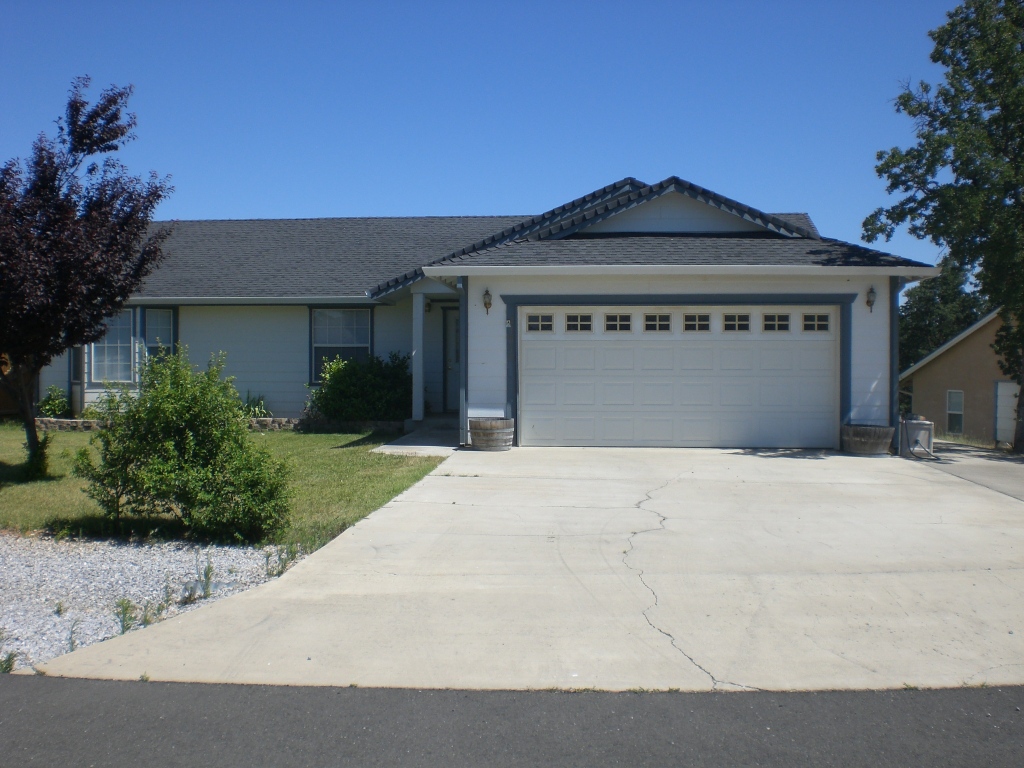
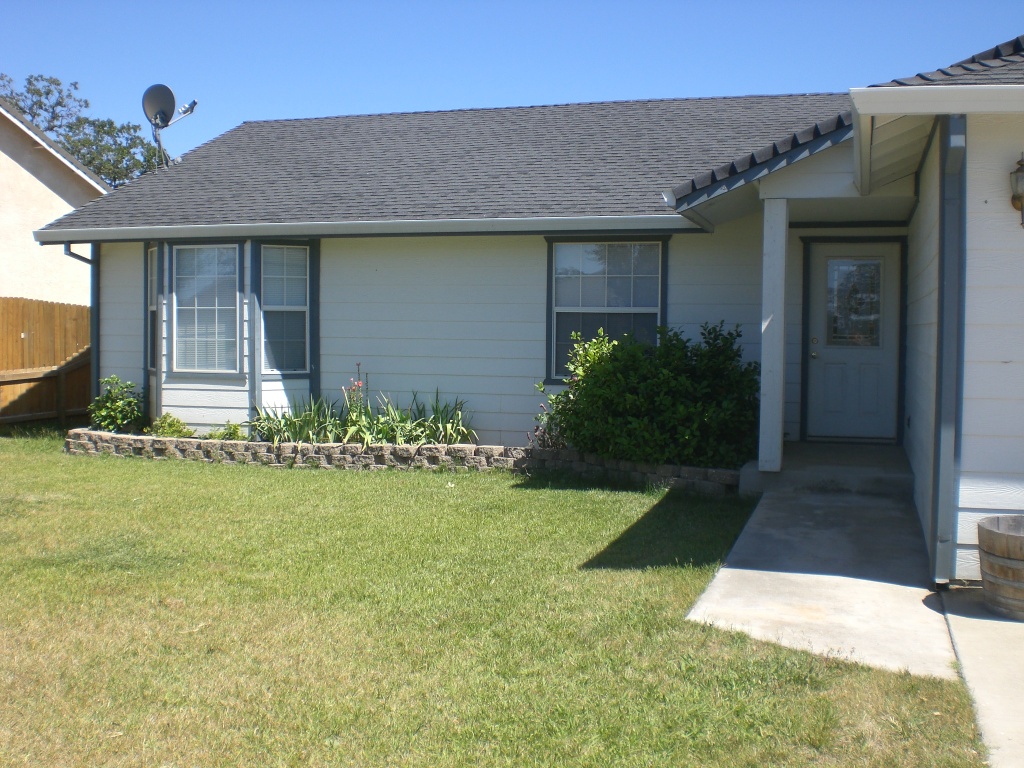
21819 Eagle Peak Dr, Cottonwood CA

Photo of Home on Eagle Peak Dr in Lake California

RENT TO OWN

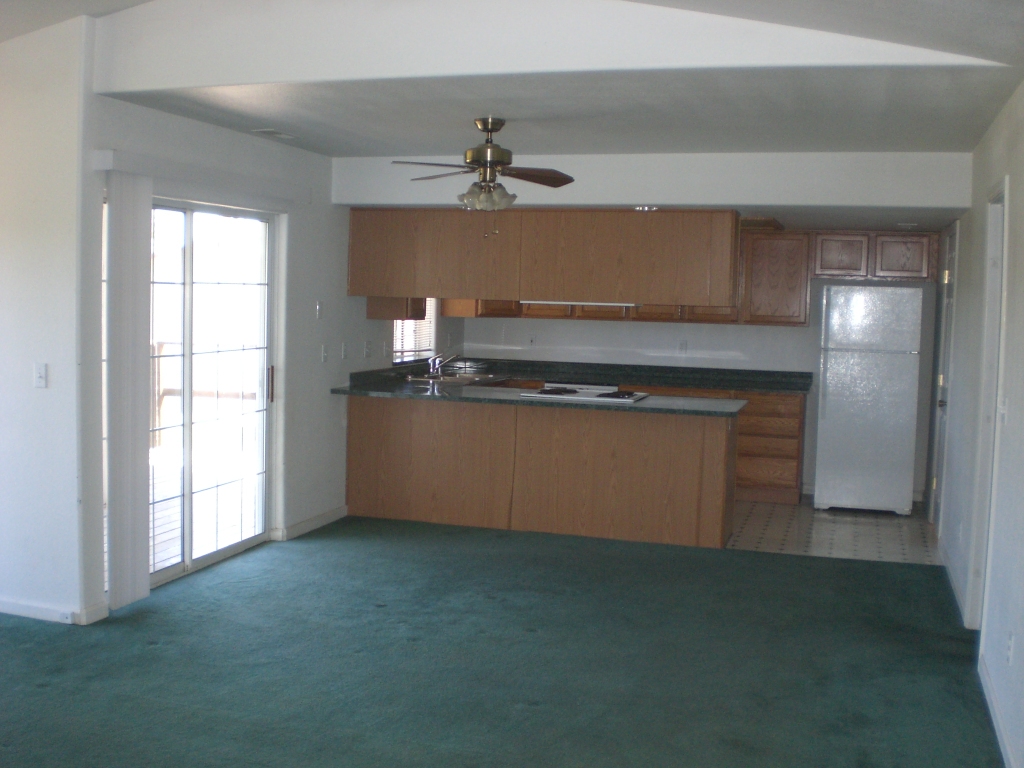
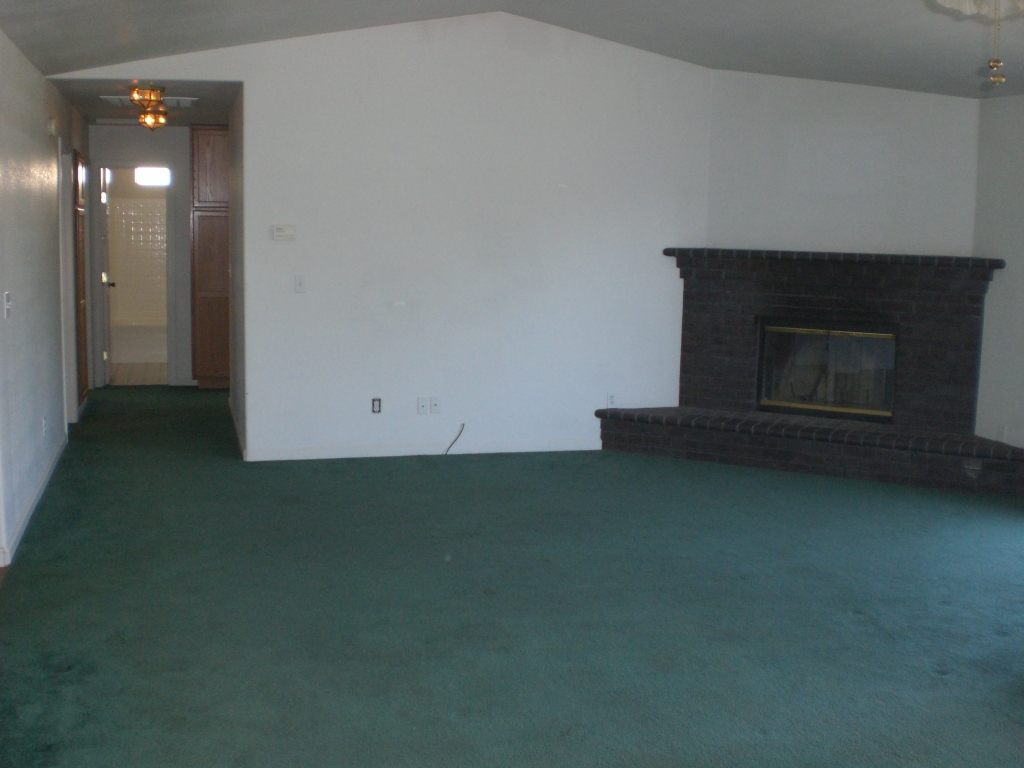
Very nice 3/3 with an open floor plan and indoor laundry. Vaulted ceilings in the family room with a gaslite fireplace. Nice views from deck and a good size backyard. Lease option available for $1,100 a month. 

Property Details

Price:
Address:
City:
State:
ZIP:
MLS #:
Square Feet:
Bedrooms:
Bathrooms:
Basement:

Additional Features:

Property Photos

Photo of Home on Eagle Peak Dr in Lake California
Photo of Front of Home on Eagle Peak Dr in Lake California
Kitchen Photo of Home on Eagle Peak Dr in Lake California
Interior photo of home on Eagle Peak Dr in Lake California

Map


View Larger Map

Pending Home Sales Decline by 2.6% in June

Pending home sales edged down with near-term sales expected to be notably lower in contrast to the spring surge when buyers rushed to take advantage of the home buyer tax credit, according to the National Association of Realtors®.

The Pending Home Sales Index,* a forward-looking indicator, declined 2.6 percent to 75.7 based on contracts signed in June from an upwardly revised level of 77.7 in May, and is 18.6 percent below June 2009 when it was 93.0. The data reflects contracts and not closings, which normally occur with a lag time of one or two months.

Lawrence Yun, NAR chief economist, said lower home sales are expected in the short term. “There could be a couple of additional months of slow home-sales activity before picking up later in the year, provided the job market continues to improve,” he said. “Over the short term, inventory will look high relative to home sales. However, since home prices have come down to fundamentally justifiable levels, there isn’t likely to be any meaningful change to national home values. Some local markets continue to show strengthening prices.”

Yun expects mortgage interest rates to remain historically low for the balance of the year, with very modest growth in employment. “We really need to see stronger job creation to have a meaningful recovery in the housing markets,” he added.

The PHSI in the Northeast dropped 12.2 percent to 58.8 in June and is 25.4 percent lower than June 2009. In the Midwest the index fell 9.5 percent to 64.1 and is 27.8 percent lower than a year ago. Pending home sales in the South rose 3.7 percent to an index of 85.8, but are 13.3 percent below June 2009. In the West the index slipped 0.2 percent to 85.1 but is 14.2 percent below a year ago.

Read more at N.A.R.’s website

Home Sales Slip 5% in June But Still Higher Than This Time Last Year

Sold HomesSales of existing homes fell further in June but still remained notably higher than year-ago levels, the National Association of Realtors (NAR) reported Thursday.  According to NAR’s report, existing-home sales came in at a seasonally adjusted annual rate of 5.37 million units in June, down 5.1 percent from 5.66 million units in May. However, sales were still 9.8 percent higher than the 4.89 million-unit pace of one year ago.

On a regional basis, existing-home sales tumbled 9 percent in the West, dropped 7.5 percent in the Midwest, and fell 6.5 percent in the South from May to June. However, sales in the Northeast soared 7.9 percent from one month to the next.

The overall decline in existing-home sales in June marked the second consecutive month-to-month drop and left sales 7.3 percent below April’s peak, a separate report by Capital Economics noted. The macroeconomic research consultancy said June’s fall was smaller than the consensus forecast of a decline to 5.1 million units and the drop to about 4.2 million units implied by the pending home sales index.

Lawrence Yun, NAR chief economist, said the market showed uncharacteristic yet understandable swings as buyers responded to the homebuyer tax credit. He said June home sales still reflected a tax credit impact, as some sales had still not closed due to delays. Due to the extension of the closing deadline for this government incentive, Yun said these closings will show up in the next two months.

“Broadly speaking, sales closed after the home buyer tax credit will be significantly lower compared to the credit-induced spring surge,” Yun said. “Only when jobs are created at a sufficient pace will home sales return to sustainable healthy levels.”

As sales fell, total housing inventory increased. According to NAR, inventory jumped 2.5 percent to 3.99 million existing homes available for sale. At the current sales pace, this represents an 8.9-month supply, up from an 8.3-month supply in May. However, raw unsold inventory remained 12.7 percent below the record of 4.58 million units in July 2008.

“The supply of homes on the market is higher than we’d like to see,” Yun said. “But home prices are still holding their ground because prices had already overcorrected in many local markets.”

According to NAR, the national median existing-home price for all housing types was $183,700 in June, coming in 1 percent higher than a year ago. Distressed homes were 32 percent of sales last month, compared with 31 percent in May and 31 percent in June 2009.

Regionally, existing-home prices fell 1.2 percent in the Northeast and inched down 0.1 percent in the Midwest from June 2009 to June 2010. During this same period, the median price in the South held steady, and prices in the West edged up 1.5 percent.

Read the full article at DSNews.com

  • « Previous Page
  • 1
  • …
  • 350
  • 351
  • 352
  • 353
  • 354
  • …
  • 366
  • Next Page »

530-222-1818
1171 Hilltop Dr
Redding CA 96003

Latest News

  • The Five Most Expensive Homes For Sale In Redding, CA
  • Homes For Sale In Redding, CA Under $300,000
  • Redding Homes For Sale – Inventory Starting to Climb
  • Redding Weekly Real Estate Report: April 8 2013
  • Palo Cedro Home Sales – February 2013

Subscribe

We have new properties coming. Get the latest updates delivered to your inbox in an easy to read email presentation. Imagine finding your next home tomorrow. It happens. Please subscribe below.

We respect and value your privacy. We will only deliver property updates to your email address.

Redding Properties

28,977 Listings
3164 Harlan Drive, Redding, CA 96003

$585,000 3 beds  2 baths  1,820 sqft 3164 Harlan Drive
Redding, CA 96003

IDX
6439 Kimberly Drive, Redding, CA 96001

$369,000 3 beds  2 baths  1,504 sqft 6439 Kimberly Drive
Redding, CA 96001

IDX
previous next

IDX MLS IDX Listing Disclosure © 2026

Information deemed reliable but not guaranteed.

Social Media

  • Facebook
  • Instagram

© Copyright 2026 Parsons Realty · Lic# 01312921 · All Rights Reserved · Powered by steelbridge.io